Makeup
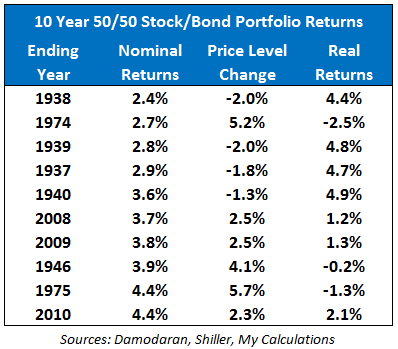
The Worst 50/50 Stock/Bond Real Returns
Jun
A 50/50 stock/bond portfolio sounds wonderfully sensible. Half the money goes into stocks for growth, half goes into bonds for stability, and everyone gets to sleep like a well-fed golden retriever. At least, that is the brochure version.
Real history is a little messier. Sometimes stocks fall because the economy is wobbling. Sometimes bonds fall because interest rates are rising. And sometimes inflation barges into the room wearing muddy boots and reminds investors that a “positive return” can still lose purchasing power. That last part is the villain in our story.
The worst 50/50 stock/bond real returns are not just about seeing a red number on a brokerage statement. They are about discovering that after adjusting for inflation, your balanced portfolio did not protect as much spending power as expected. A portfolio can look modestly bruised in nominal dollars but far worse in real dollars. Inflation is the accountant who checks the receipt after the party.
What Is a 50/50 Stock/Bond Portfolio?
A 50/50 portfolio typically means 50% equities and 50% fixed income. In a U.S. context, the stock side is often represented by the S&P 500, a total U.S. stock market fund, or another broad equity index. The bond side may be represented by intermediate-term U.S. Treasuries, total U.S. bonds, or high-quality investment-grade bonds.
The appeal is simple. Stocks can compound wealth over long periods, but they can also fall dramatically. Bonds usually offer income and lower volatility, and in many market crashes they have helped cushion stock losses. The portfolio is not designed to win every race. It is designed to finish the marathon without requiring the investor to scream into a decorative pillow every quarter.
Why Real Returns Matter More Than Nominal Returns
Nominal return is the return you see before inflation. Real return is what remains after inflation. If a portfolio rises 5% in a year but inflation is 8%, the investor is not richer in practical terms. The portfolio’s dollar value increased, but its buying power declined.
This distinction is crucial when studying the worst 50/50 stock/bond real returns. Investors often focus on market crashes like 2008, when stocks plunged and fear dominated headlines. But some of the ugliest real-return periods happened when inflation was high and bonds failed to provide the usual defense.
In plain English: losing money hurts. Losing money while groceries, rent, insurance, tuition, and everything except your old gym membership get more expensive hurts twice.
The Historical Problem: Stocks and Bonds Can Fall Together
The classic balanced-portfolio story depends on diversification. Ideally, when stocks fall, bonds rise or at least hold steady. That relationship has often worked, especially during deflationary recessions or growth shocks. But it does not always work.
When inflation rises sharply, central banks may increase interest rates. Rising rates can reduce bond prices, especially for longer-duration bonds. At the same time, higher inflation can pressure company profits, reduce investor confidence, and compress stock valuations. In those environments, both sides of a 50/50 portfolio can take damage at once.
That is when diversification still exists, but it feels like bringing an umbrella to a windstorm. Technically useful, emotionally questionable.
The Worst Real-Return Environments for a 50/50 Portfolio
1. The 1970s: Inflation Ate the Balanced Portfolio’s Lunch
The 1970s are one of the most important periods for understanding poor real returns. Stocks struggled through valuation compression, recessions, oil shocks, and investor pessimism. Bonds also suffered because inflation and rising interest rates reduced the real value of fixed payments.
For a 50/50 investor, the decade was frustrating because the traditional safety asset did not feel very safe after inflation. Nominal bond income existed, but inflation kept nibbling at it like a very persistent mouse. Stocks had sharp rallies, but they also endured deep drawdowns. The result was a difficult period for anyone relying on a balanced portfolio to preserve purchasing power.
The lesson is not that 50/50 portfolios are broken. The lesson is that inflation regimes matter. A portfolio that looks stable in a low-inflation world can behave very differently when inflation is high and interest rates are rising.
2. 1931: Deflation, Depression, and Brutal Stock Losses
The early 1930s produced some of the most severe stock market losses in U.S. history. In 1931, equities suffered a devastating decline. Bonds did not collapse the way stocks did, but they were not enough to fully protect a balanced portfolio from major damage.
Interestingly, the real-return picture during the Great Depression is complicated by deflation. Falling consumer prices meant that a given dollar bought more goods and services, which softened some inflation-adjusted measures. Still, for investors watching portfolio values fall during bank failures, unemployment, and economic crisis, “at least inflation is negative” was probably not the comfort phrase of the century.
For a 50/50 portfolio, 1931 stands as a reminder that bonds can reduce losses without eliminating them. A balanced allocation is a shock absorber, not a force field.
3. 1974: Stocks Fell, Inflation Surged, and Bonds Were No Hero
In 1974, U.S. investors faced a nasty combination: a bear market in stocks, high inflation, rising rates, and economic stress. This is one of the classic examples of why real returns matter. Even if a nominal decline looks manageable compared with a pure stock portfolio, the inflation-adjusted damage can be severe.
A 50/50 portfolio in this kind of environment can feel especially disappointing. The investor accepts lower long-term expected returns than an all-stock portfolio in exchange for stability. But when bonds are pressured by inflation and stocks are falling too, the bargain feels unfair. It is like paying extra for a hotel room with an ocean view and getting a lovely view of the parking lot.
4. 2008: Stocks Crashed, but Bonds Helped
The global financial crisis was terrifying for equity investors. Stocks fell sharply, credit markets froze, and headlines sounded like they had been written by a committee of thunderclouds. Yet for many balanced portfolios, high-quality bonds did their job. Treasury bonds and other defensive fixed-income assets helped offset some equity losses.
That makes 2008 different from the worst inflation-driven real-return periods. The nominal drawdown was painful, but bonds provided meaningful diversification. Inflation was not the same kind of enemy it was in the 1970s or 2022. For 50/50 investors, 2008 was bad, but it also demonstrated why the strategy exists in the first place.
5. 2022: The Modern Wake-Up Call
For many investors, 2022 was the year the balanced portfolio lost its halo. Stocks fell. Bonds fell. Inflation was high. Interest rates rose quickly. The result was a rare and painful period when both halves of a traditional stock/bond portfolio moved in the wrong direction.
For a 50/50 portfolio, 2022 was especially uncomfortable because the bond side was supposed to be the adult in the room. Instead, bonds also had a rough year as yields climbed and prices dropped. After adjusting for inflation, real returns looked even worse.
This does not mean the 50/50 stock/bond portfolio is dead. Financial commentators declare traditional portfolios dead so often that someone should give the phrase its own retirement account. But 2022 did prove that bonds are not magic. Their protection depends on starting yields, duration, inflation, and the reason stocks are falling.
Why a 50/50 Portfolio Can Still Have Bad Real Returns
Inflation Can Hurt Both Assets
Inflation is the main troublemaker. Stocks may eventually pass higher prices through to customers, but not always quickly or smoothly. Bonds are more directly exposed because fixed payments become less valuable when inflation rises. If interest rates increase to fight inflation, existing bond prices can fall.
Starting Valuations Matter
High stock valuations can reduce future equity returns. Low bond yields can reduce future bond returns. When a 50/50 portfolio begins from expensive stock prices and low bond yields, future real returns may be less generous. The portfolio is not doomed, but the starting line matters.
Bond Duration Matters
Not all bonds behave the same way. Long-term bonds are more sensitive to interest-rate changes than short-term bonds. A 50/50 portfolio with long-duration bonds may suffer more when rates rise quickly. Intermediate bonds may offer a middle ground, while short-term bonds can be less volatile but usually offer lower long-term return potential.
Rebalancing Helps, but It Does Not Prevent Pain
Rebalancing is a core feature of many 50/50 strategies. When stocks fall, an investor may sell some bonds and buy stocks to restore the target allocation. When stocks surge, the investor trims stocks and buys bonds. This disciplined process can help over time, but it does not guarantee positive real returns during every period.
Worst Real Returns Are Often About Sequences
The danger is not only the average return. It is the order of returns. A retiree withdrawing money during a bad real-return period faces sequence-of-returns risk. If the portfolio falls early in retirement while withdrawals continue, the damage can be hard to repair.
For example, a young investor contributing monthly during a bad decade may actually benefit from lower prices. The same bad decade can be brutal for a retiree selling assets to fund living expenses. The portfolio is the same. The life stage is not.
That is why “worst 50/50 stock/bond real returns” is more than a historical trivia topic. It is directly connected to retirement planning, withdrawal rates, risk tolerance, and the emotional endurance required to stay invested.
How Investors Can Prepare for Poor Real-Return Periods
Keep Expectations Realistic
A 50/50 portfolio is moderate, not magical. It can lose money. It can lag inflation. It can go through long stretches where returns feel disappointing. Investors who understand this ahead of time are less likely to panic when history does what history does best: act inconvenient.
Use Broad Diversification
A basic U.S. stock and bond mix can be powerful, but investors may also consider international stocks, Treasury Inflation-Protected Securities, short-term bonds, cash reserves, real estate investment trusts, or commodities depending on their goals and risk tolerance. The point is not to collect asset classes like souvenir magnets. The point is to understand what each holding is supposed to do.
Watch Inflation Risk
Investors who care about real returns should pay attention to inflation protection. TIPS, shorter-duration bonds, I Bonds when available, and flexible spending plans can all help manage inflation risk. No tool is perfect, but pretending inflation does not exist is not a strategy. It is a wish wearing a spreadsheet costume.
Match the Portfolio to the Goal
A 50/50 allocation may be reasonable for moderate investors, retirees, or people who cannot stomach large equity drawdowns. But it is not automatically right for everyone. A young investor with decades ahead may prefer more stocks. A retiree with near-term spending needs may need more cash and short-term bonds. The best allocation is not the one that looks smartest in a chart. It is the one the investor can actually hold through ugly markets.
Specific Example: Why 2022 Felt So Bad
Imagine an investor with $100,000 in a simple 50/50 portfolio entering 2022. If both the stock and bond portions fell, the investor might see the account drop into the mid- or low-$80,000s depending on the exact funds used. That is already unpleasant. Then inflation reduces the purchasing power of the remaining dollars. The real value of the portfolio falls even more.
This is the key emotional difference between nominal and real losses. A statement balance tells one story. The grocery cart tells another.
For investors who had only experienced the bond bull market from the early 1980s through the 2010s, 2022 was shocking. For decades, falling interest rates often helped bonds when stocks struggled. But when inflation returned and rates rose quickly, the old pattern broke. The balanced portfolio still provided diversification compared with owning only stocks in many cases, but it did not provide the comfort investors expected.
Is the 50/50 Portfolio Still Worth Considering?
Yes, but with adult supervision from reality. A 50/50 stock/bond allocation can still be a sensible, diversified, easy-to-maintain strategy. It offers less equity risk than an all-stock portfolio and more growth potential than an all-bond portfolio. It is simple, understandable, and historically resilient over many long periods.
However, investors should not confuse “balanced” with “safe from losses.” The worst real-return periods show that inflation, rising rates, and poor starting valuations can challenge even conservative-looking portfolios. The right lesson is not to abandon balance. The right lesson is to define balance more thoughtfully.
Experience-Based Reflections on the Worst 50/50 Stock/Bond Real Returns
One practical experience many investors share is that bad real returns feel worse than they look on paper. A chart might show a 15% decline, but life does not happen on a chart. Life happens when the car needs repairs, rent increases, groceries cost more, and the portfolio statement looks like it needs a motivational podcast.
The first experience-based lesson is that investors should rehearse bad markets before they happen. This does not mean sitting in a dark room whispering “1974” into a calculator. It means asking honest questions. What would I do if my balanced portfolio lost 15% after inflation? What if it took several years to recover? Would I keep rebalancing, reduce spending, or change the plan?
The second lesson is that cash reserves matter. A 50/50 portfolio can be appropriate, but retirees and near-retirees may still need a dedicated cash buffer for short-term expenses. Selling assets during a real-return drawdown can lock in losses. Having cash available can provide breathing room, and breathing room is underrated in finance. It is also underrated while assembling furniture.
The third lesson is that investors should understand their bond funds. Many people hear “bonds” and think “safe.” But bond funds can lose value, especially when interest rates rise. Duration, credit quality, and inflation exposure matter. A long-term Treasury fund behaves differently from a short-term Treasury fund. A high-yield bond fund behaves more like a risk asset than a pure defensive holding.
The fourth lesson is emotional. The worst real-return periods often arrive with convincing stories about why the future will be terrible. In the 1970s, inflation and economic stagnation dominated the mood. In 2008, the financial system looked fragile. In 2022, inflation and rate hikes made the old stock/bond relationship feel broken. Every bad period comes with a believable script. The investor’s job is not to ignore the script, but to avoid letting panic become the portfolio manager.
The fifth lesson is humility. A 50/50 portfolio is not a prediction machine. It is a planning tool. Its purpose is to balance growth and stability across uncertain futures. Sometimes it will disappoint. Sometimes it will quietly do its job while flashier strategies crash into the bushes. The investor who survives is often not the one with the cleverest forecast, but the one with the most durable plan.
Finally, the worst 50/50 stock/bond real returns teach that purchasing power is the real scoreboard. Investors do not save money to admire nominal dollars. They save to buy future groceries, housing, healthcare, travel, education, and freedom. A balanced portfolio remains useful, but it should be judged by how well it supports real-life goals after inflation, taxes, fees, and behavior are included. That is less glamorous than chasing the hottest asset of the year, but it is also less likely to end with someone muttering at a brokerage app at midnight.
Conclusion
The worst 50/50 stock/bond real returns usually occur when stocks and bonds struggle at the same time and inflation reduces purchasing power. The 1970s and 2022 are especially useful reminders that balanced portfolios are not immune to real losses. The Great Depression, 1974, 2008, and recent inflation shocks all show different ways a stock/bond mix can be tested.
A 50/50 portfolio can still be a smart allocation for many investors, but it should be used with clear expectations. It is not a guarantee. It is a compromise: less aggressive than all stocks, more growth-oriented than all bonds, and simple enough for disciplined investors to maintain. The key is to plan for bad real-return periods before they arrive, because markets rarely send polite calendar invitations.
Note: This article is for educational and informational purposes only. It is not financial, investment, tax, or retirement-planning advice. Historical returns do not guarantee future results.
